
Inside the squeeze: how $341M of whale shorts died in 36 hours
In the third week of August, Bitcoin rose 22 percent in four days. If you watched it on a price chart, you saw a line going up rather briskly, and perhaps a few people on your feed discovering religion. If you watched it in the flow data, you saw something considerably more interesting: a three-act play with a proper villain, a body count, and a changing of the guard at the end.
We rather enjoy this sort of thing, so we took the week apart properly. Here is what actually happened.
The setting: a market wound to a standstill
By mid-August, Bitcoin had spent seven weeks going nowhere in particular, parked in a narrow band with thirty-day volatility at the 3.6th percentile of everything recorded since 2017. In plain terms: one of the quietest stretches in the asset’s history, sitting 42 percent below its old high, with everyone thoroughly bored.
Markets wound that tightly do not tend to unwind politely. Compression is stored energy. The only open question was the direction, and on that point the visible positioning had an opinion: the large accounts on Hyperliquid, where positions are public, were carrying roughly $341 million of shorts against a modest $147 million of longs. The big money, on that venue at least, was leaning down.
It was leaning wrong.
Act one: the flush
On the Tuesday, price dipped to new local lows around $62,500, and open interest fell about four percent into the move. Translation: leveraged longs were being escorted out at the worst possible moment, which is what usually happens just before the worst possible moment reverses.
Then the whale flow turned. Orders of $250,000 and above went from tentative to insistent, and the aggregate whale line across five exchanges began climbing while the price was still on the floor. This is the single detail worth remembering from the whole affair: the biggest orders in the market started buying before the chart gave anyone else a reason to.
Act two: the annihilation
What followed over the next 36 hours was less a rally than a controlled demolition. As price pushed up through one shelf after another, the shorts’ own stop-losses became the fuel: every forced buy-back pushed price into the next cluster of stops, which forced the next round of buying back, and so on up the staircase.
The numbers deserve their moment. The visible whale short book on Hyperliquid went from $341 million to $26 million. Ninety-two percent of it, gone. Including the longs those same accounts built on the way, the net swing in positioning was roughly $584 million, executed at whatever price the market cared to offer, because a trapped short does not get to negotiate.
“A short squeeze is a one-way tape by construction. Forced buyers do not wait for dips. They pay up, and their paying up is the move.”
Meanwhile the crowd did something telling. The retail long-to-short ratio fell from 1.85 to about 1.0 during the rally: small accounts sold into it and, in many cases, tried to short it. The whales bought a 22 percent move off a disbelieving public. It is not often the tape hands you so clean a diagram of who was on which side.
Act three: the changing of the guard
By the Friday, price had reached the high seventies and the character of the flow changed. The one-way conviction gave way to violent churn: whale flow swinging from heavy buying to heavy selling and back within hours, the book being trimmed and rebuilt, the first genuinely two-sided fighting of the week, right at the levels where the old structure from the spring says the argument matters most.
That churn is not a verdict. It is the sound of a market renegotiating. Squeezes end when the forced buying runs out; whether something more durable replaces it is decided afterwards, at precisely this sort of level, by precisely this sort of fight.
What history says about weeks like this
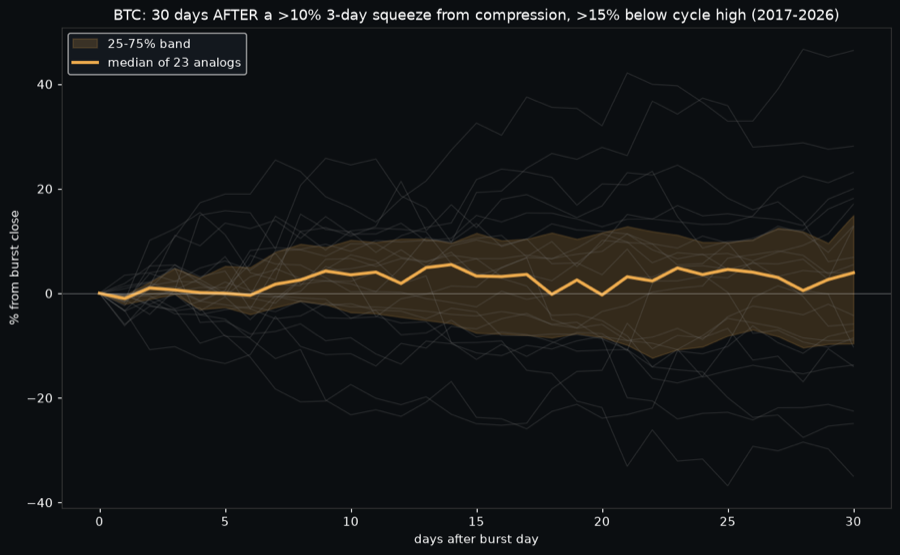
We searched every episode since 2017 that matched this week’s fingerprint: a rally of ten percent or more inside three days, launched out of compression, from deep below the prior high. There are 23 of them. The record afterwards, in brief:
- The day immediately after the burst was red about four times in five. A pause is the norm, not a warning.
- In roughly nine cases out of ten, price printed a marginal new high within a fortnight. These moves rarely stop dead.
- And yet about half also gave back fully half the rally inside the same fortnight. The typical script, in other words: one more push, then a proper retracement.
- Where things went from there depended almost entirely on regime: the episodes that launched from long bases after a well-tested low aged very well; the mid-bear relief rallies aged very badly. Telling those apart in advance is, regrettably, the entire difficulty.
The moral of the week
None of this required clairvoyance. It required watching the right things: who was positioned where, who was being forced, and who was buying whilst the crowd looked away. That is the entire premise of BTC Pulse: the price chart tells you what happened; the flow tells you who made it happen, and who paid for it.
The $341 million question, of course, is what the survivors do next. The machine is watching. So, now, are you.